The map
This page lists what the map holds, what its controls do, and what the map's measuring, typed-points, PDF map, survey export and corridor pages rely on. Each task page links to the part it needs. For the steps to open a project, see Open a project on the map.
The parts of the map
The map is a fixed grid around the survey. Panels resize the map instead of covering it.
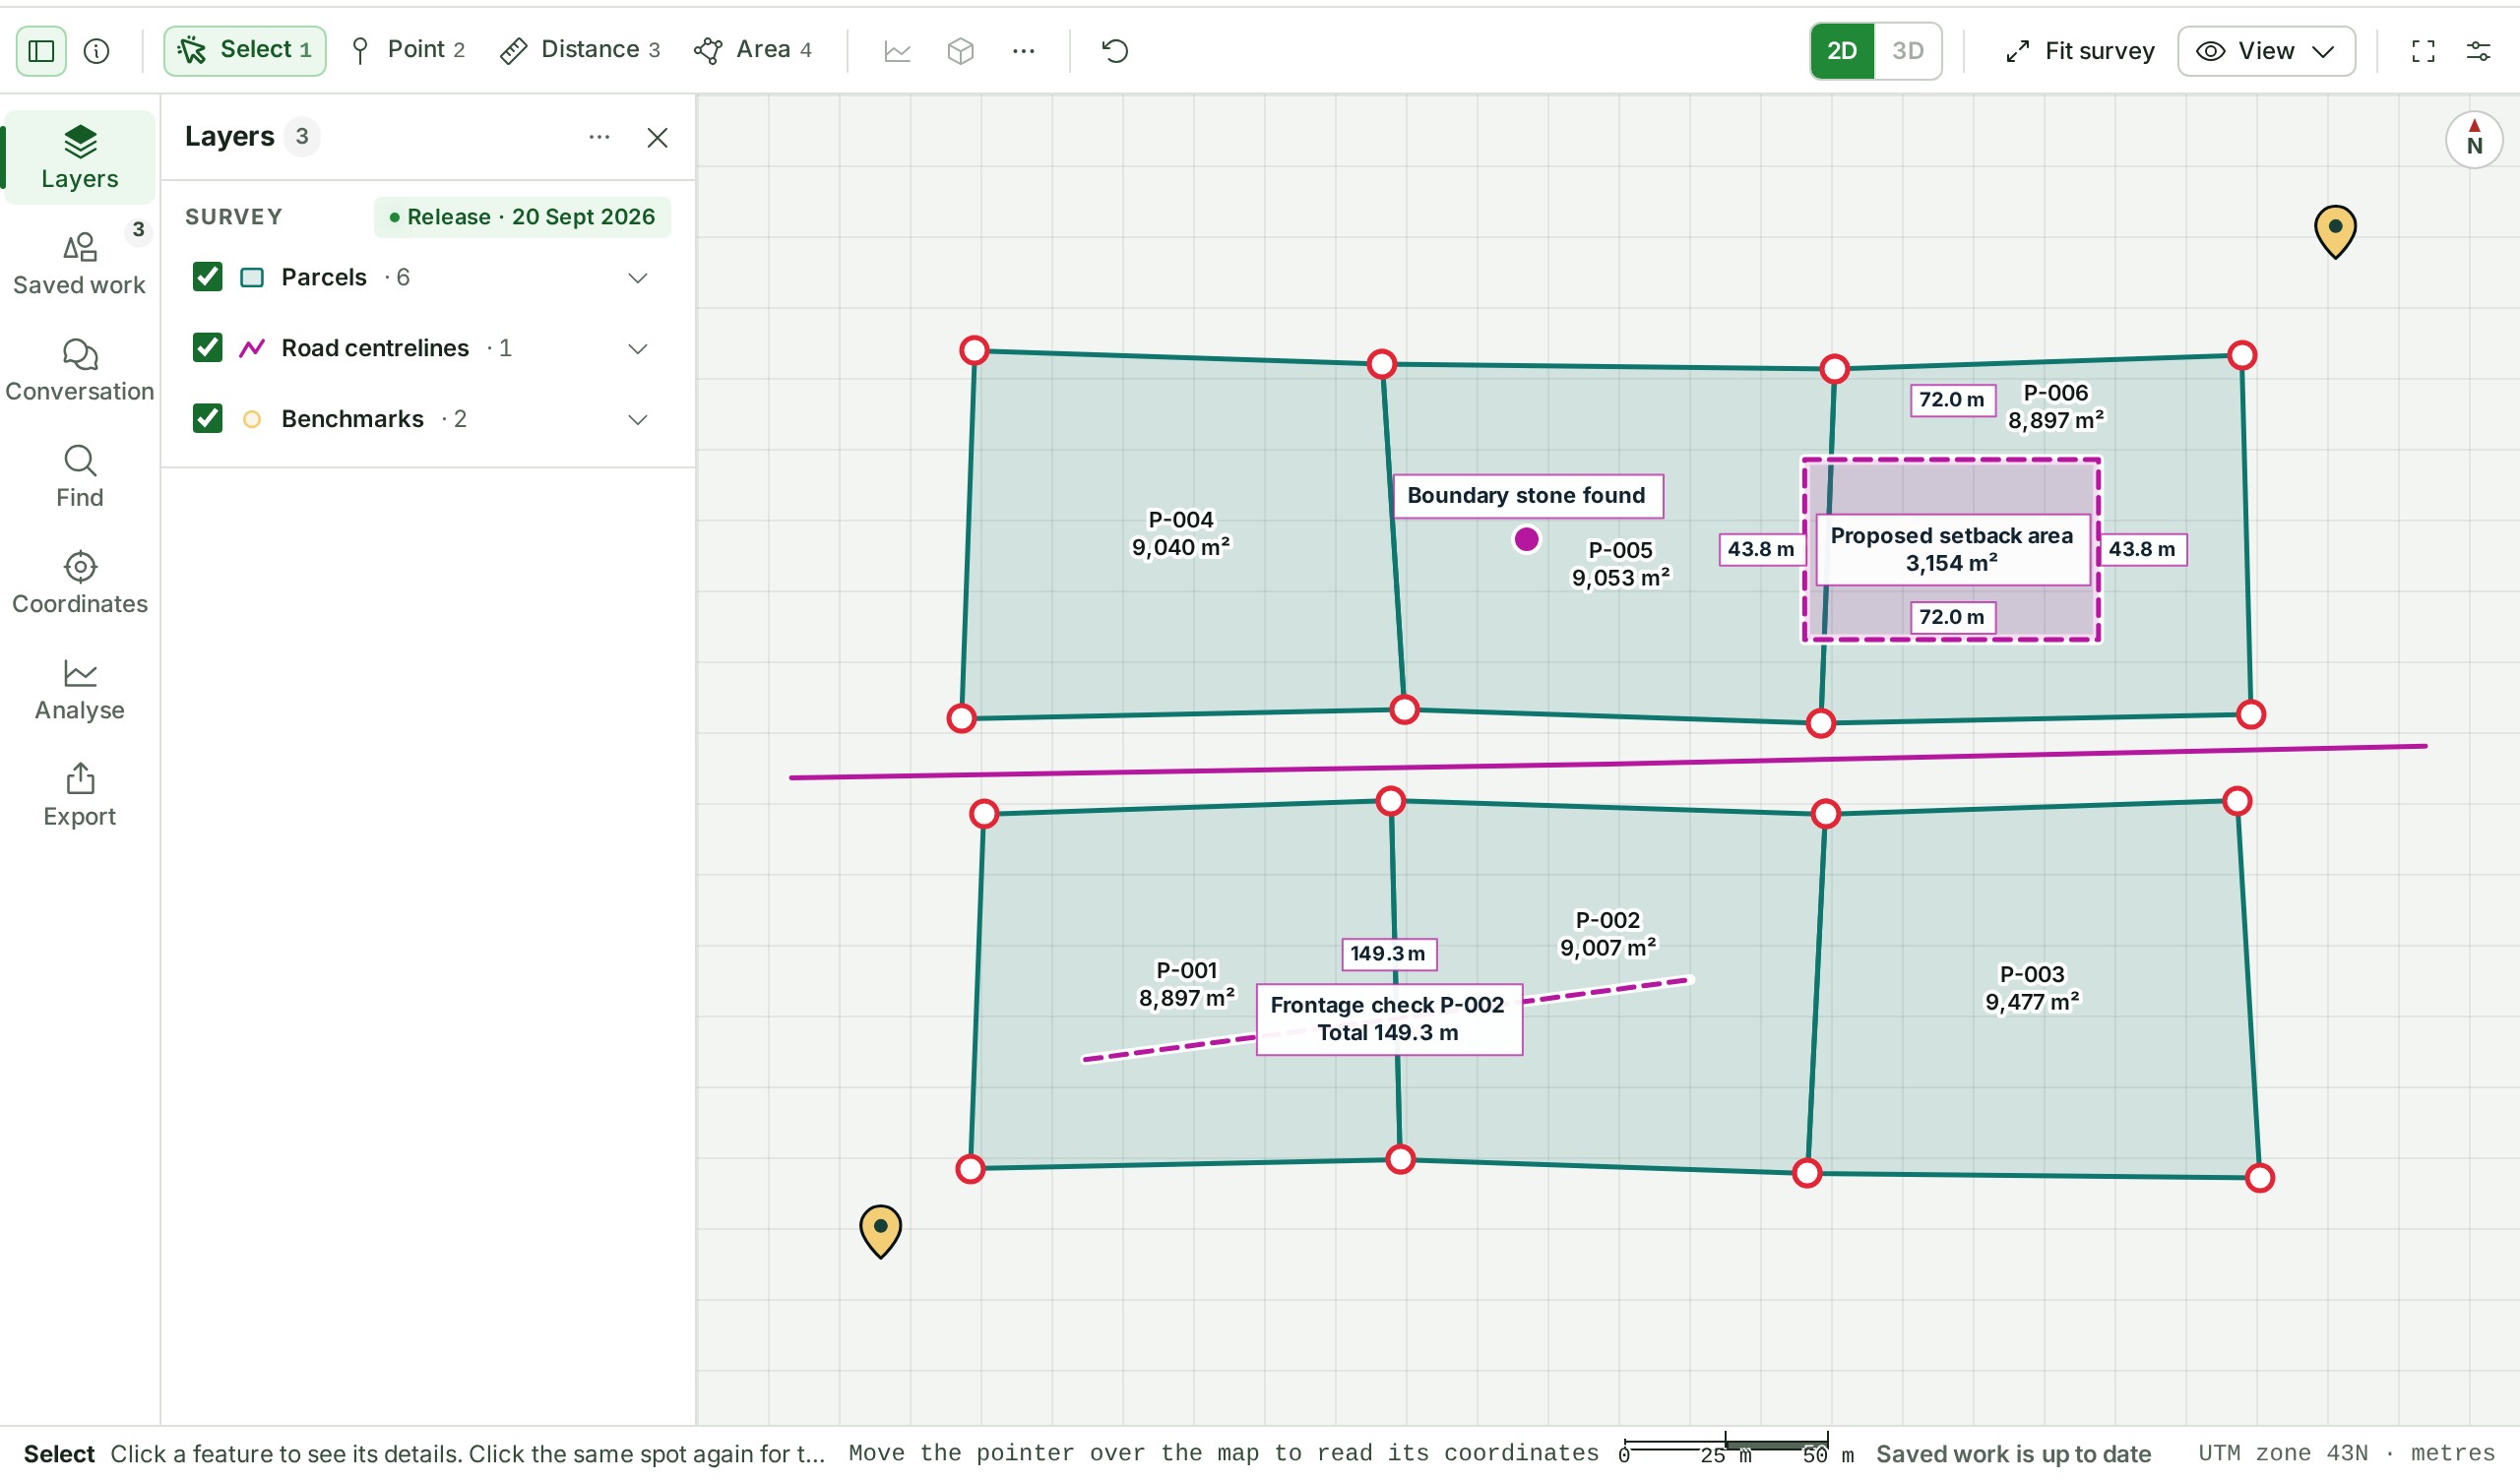
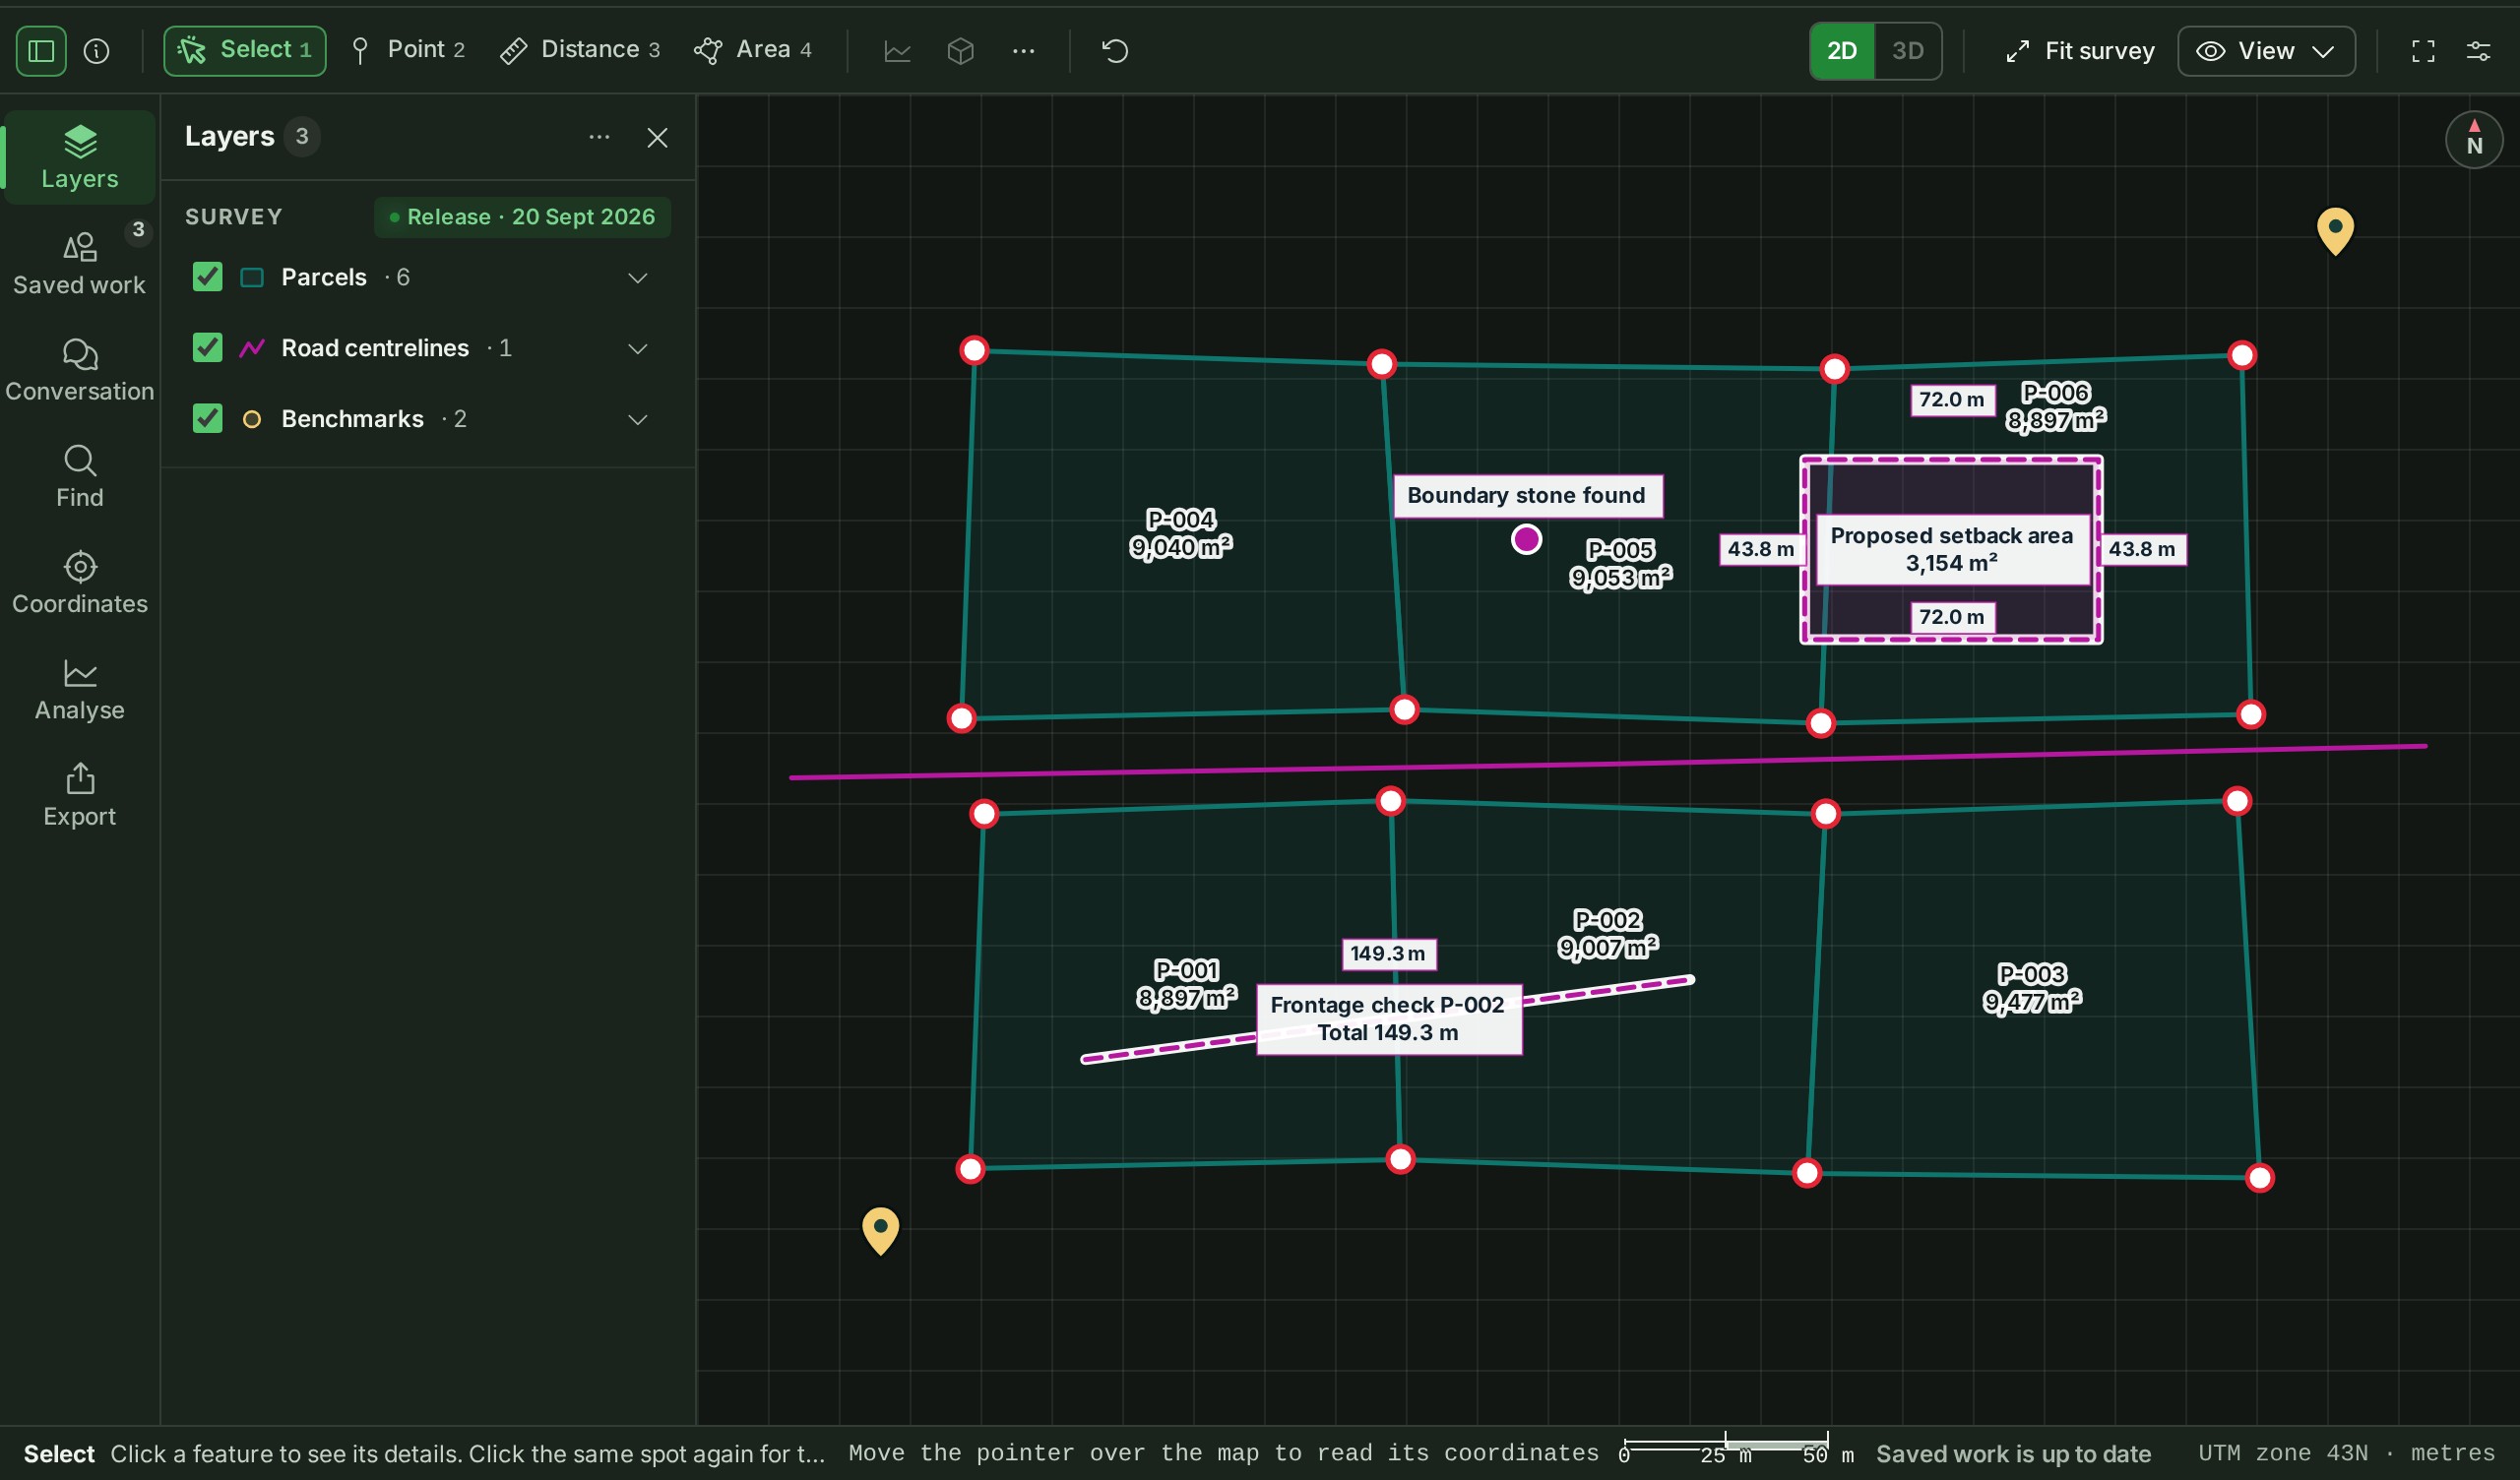
| Part | Where | What it holds |
|---|---|---|
| Title bar | Across the top | The project's number and name, the project switcher, who else is viewing, Upload, Help, notifications, the Console button and the account menu. A chip beside the name says when the release is shared, a draft or in review, or the sample project. |
| Tool strip | Above the map | The dock toggles, the drawing tools (Select, Point, Distance, Area), Undo, the 2D and 3D switch, the view controls (the Fit survey button and the View menu), Focus the map and the Layout menu. Point at a control, or reach it with Tab, to see its name and its key. |
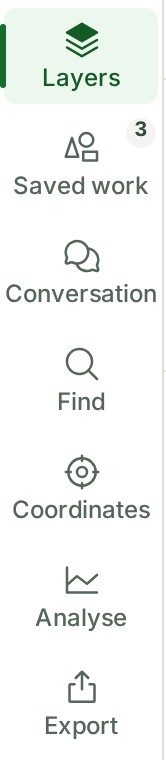
| Rail | Down the left edge | Chooses what the left dock shows: Layers, Saved work, Conversation, Find, Coordinates, Analyse and Export (a name shows under each icon on a wide screen; on a narrow one, point at the icon). Saved work holds your saved measurements. |
| Left dock | Beside the rail | One panel at a time, chosen from the rail. |
| Inspector | On the right | Appears when you select something or use a tool that has a panel, and shows the tool's panel first, then what is selected: its attributes, its Conversation and its Files. |
| Bottom dock | Under the map | Tabs that appear once one of them has something to show, such as Compare and, in a corridor review, Sections. |
| Status bar | At the foot | The tool's next step, the pointer's position, the reference system and units, the scale bar and the save state. |
Any panel can be hidden from the tool strip or its rail button; it keeps what you were doing in it. Drag a panel's inner edge to resize it, or choose Reset layout in the Layout menu. Open a saved drawing’s History from Saved work.
GISweaver remembers your panels, their sizes and your last view for this person, project and release.
Esc steps back one level at a time: it drops what you were typing, then stops placing a shape (the shape drawn so far stays as a draft), then puts the active tool down and returns to Select, then clears the selection.
The Map guide, a short guide inside the app, opens from Help in the bar at the top (on a phone, from the menu).
The view controls
Fit survey is a button of its own on the tool strip. The rest are in the View menu beside it.
| Control | Key | What it does |
|---|---|---|
| Fit survey | F | Frames the whole survey: the area its layers cover, wherever that is, in 2D and in 3D. |
| Zoom to selection | Z | Frames what you have selected. |
| Window zoom | W | Drag a box on the map; the map zooms to it. |
| Previous view, Next view | Alt+← and Alt+→ | Step back and forward through the views you have had. |
Formats the Coordinates panel reads
| Format | Example |
|---|---|
| Latitude and longitude, as Google Maps or a phone gives them | 10.5276, 76.2144 |
| Easting, northing and height, from a total station or a spreadsheet, separated by commas, spaces, tabs or semicolons, with or without a point number in front and a code behind | P12, 646842.836, 1107159.434, 4.215, BM |
| A column of values, one per line | 646842.836 then 1107159.434 then 4.215, each on its own line |
| Degrees, minutes and seconds, with N, S, E and W | 10°31′39.4″N 76°12′51.8″E |
The controls in a layer's details
Open a layer's details with the arrow at the end of its row.
| Control | What it does |
|---|---|
| Zoom to layer | Frames that layer on the map. |
| Isolate | Hides every other layer until you select Show the others again. |
| Opacity | A slider for how solid the layer is drawn. A point cloud or an elevation grid is drawn at As delivered opacity. |
| Colour and Thickness | For contour lines, where they apply. |
| Elevation colours | For an elevation grid, where it applies. |
Measuring
Which distance you are reading
Each figure says how it was measured: on the grid (EPSG:32643) for a survey in a projected system (the code is the survey's own), or on the WGS 84 ellipsoid for a geographic one. A grid distance is not a ground distance, so read the label before you use a figure for setting out.
Controls and units
| To | Do this |
|---|---|
| Remove the latest measurement | Undo measurement on the tool strip |
| Remove all of them | Clear measurements, under More on the tool strip |
| Delete one | Select it, open its menu in the Inspector, choose Delete, then Delete measurement |
| Keep an unfinished shape when you pick another tool | Nothing to do: it is listed under Unfinished drawings and comes back when you pick its tool again |
| Drop unfinished shapes | Discard unfinished drawings |
Distances show in metres, or kilometres from 1 km. Areas show in m², hectares or km². To also see a local land unit, choose it in Preferences under Land units.
On a phone, Distance is on the strip: tap each point and double-tap to finish. Areas are drawn on a larger screen.
Typed points
Heights
Each point can have No height, a Typed height, or one Sampled from grid when the survey has an elevation grid. A typed height needs its Reference (for example EPSG:5773) and Unit.
Add, remove or snap a point
Each row's menu (More for point n) has Snap (move it onto the nearest delivered or saved vertex), Sample height, Insert after and Remove. To place a point by clicking the map instead, see Place a point by clicking, with snapping.
Where exact figures are qualified
The server works out every length, distance and area of an exact measurement, for projects on EPSG:32643 (WGS 84 / UTM zone 43N) and on EPSG:4326 (WGS 84) and no other system. A point outside the zone (longitudes 72°E to 78°E, north of the equator) is refused.
Each save is an immutable version. A later edit makes a new version and never overwrites an earlier one, and a published release pins the versions current at publication.
Change your mind
Undo takes back the last change, and Discard edits drops everything since the last saved version.
Where you can do this
Typing exact points needs a larger screen: on a phone, More lists Editing the points under On a larger screen. Delivered survey features are read-only and have no Type exact points; only your own saved work does.
PDF maps
What the sheet holds
The sheet is A3 or A4. The plan sheet carries a coordinate grid, a legend, a north arrow, a scale bar and this title block:
| Title block field | Where it comes from |
|---|---|
| Project | The project's title |
| Site, Land ID, Survey no., District | The site's record (Survey no. only when the site has one) |
| Horizontal CRS, Vertical datum | The site's record |
| Survey agency, Surveyed | The site's record |
| Scale, Sheet | Your choices under Output (the sheet is its size and orientation) |
Schedules of coordinates and measurements follow it, and each 3D view is a page of its own marked Not to scale — illustrative. A coordinate schedule holds at most 1000 points; a longer one is cut short, and the sheet says how many rows it shows.
A drawing is not the source files
A plan sheet is a new document made from the view you chose. It does not change the release, and it is not a substitute for the original survey files. To send the files themselves, use a delivery or a permitted release download.
To send the coordinates as DXF, GeoJSON or CSV, see Issue a survey export.
On a phone
PDF maps and survey exports are made on a larger screen: on a phone, More lists Exports under On a larger screen.
Survey exports
The formats
- DXF: a drawing on the EPSG:32643 grid, in metres, one layer per kind of measurement, with a small file beside it that says where each coordinate came from. Needs projected coordinates.
- GeoJSON: features in WGS 84 longitude and latitude, each point keeping the coordinates you typed, its height and its source.
- CSV: a table of the points the selection holds (easting, northing and height), with a separate metadata file. Needs projected coordinates.
Exporting a release
A published release exports every exact measurement that the release held when it was published. Anything else in the release, such as a free drawing, is listed as left out.
If you were sent a release for review
An organisation that was sent a release for review can export survey files from it only when the sender's access includes downloading original files. While the sending organisation is suspended or closed, the reviewer can neither make a new export nor download one already made. The sender's Audit trail records each export and each file the reviewer downloads, naming the reviewing organisation.
Limits
An organisation can hold up to 2,000 issued exports or 2 GiB of export files, whatever its plan. Issued exports are kept permanently, so an organisation that reaches the ceiling stays there; every export already issued can still be downloaded. Many requests in quick succession make the server ask you to wait briefly.
Corridor review
What a station is
Stations are the points every station interval along the line (25 m, say), and also the two ends if the alignment was saved with Include the start and the end. The list shows each one as kilometres plus metres: 1+225.000 is 1 km and 225 m from the line's zero.
What the cross-section shows
The cross-section is read from the published elevation grid, not from a point cloud. You choose its width, spacing and height stretch:
| Control | Choices |
|---|---|
| Half-width | 10, 25, 50 or 100 m each side of the line |
| Spacing | 0.5, 1, 2 or 5 m between heights |
| Exaggeration | Fit, 1×, 2×, 5× or 10× |
Exaggeration stretches the drawing upwards without changing any height. A place with no height is drawn as a gap, never as zero, and the panel says how many samples have none.
Lengths are grid lengths
Chainage is measured on the UTM zone 43N grid, with no scale-factor or height reduction.
The product words on this page are explained in the glossary.
Parcel attributes and comparison
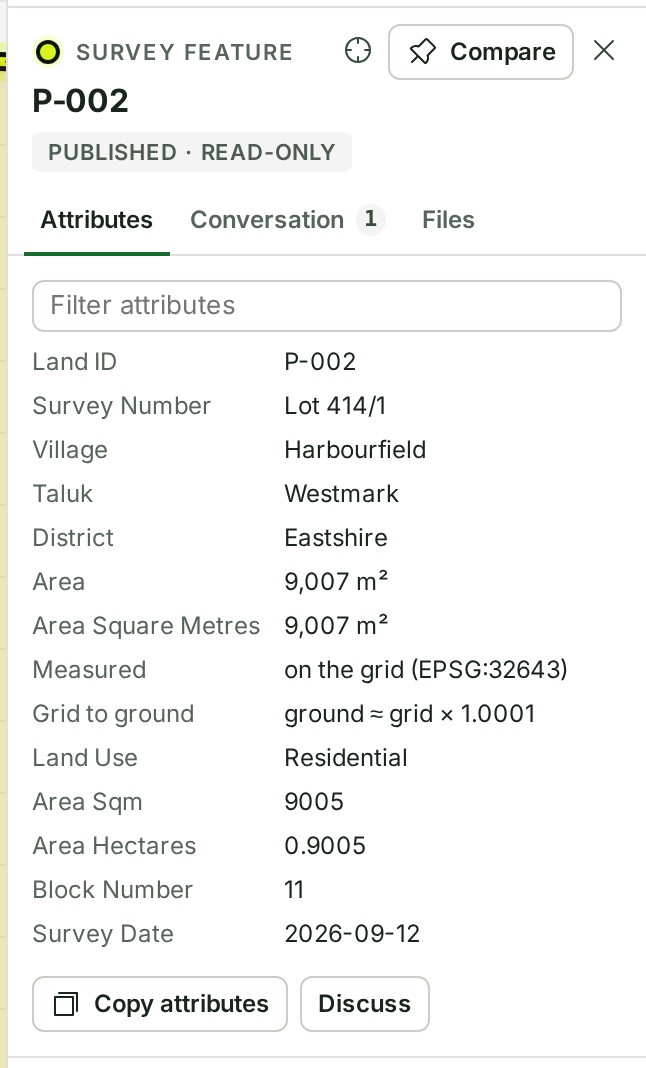
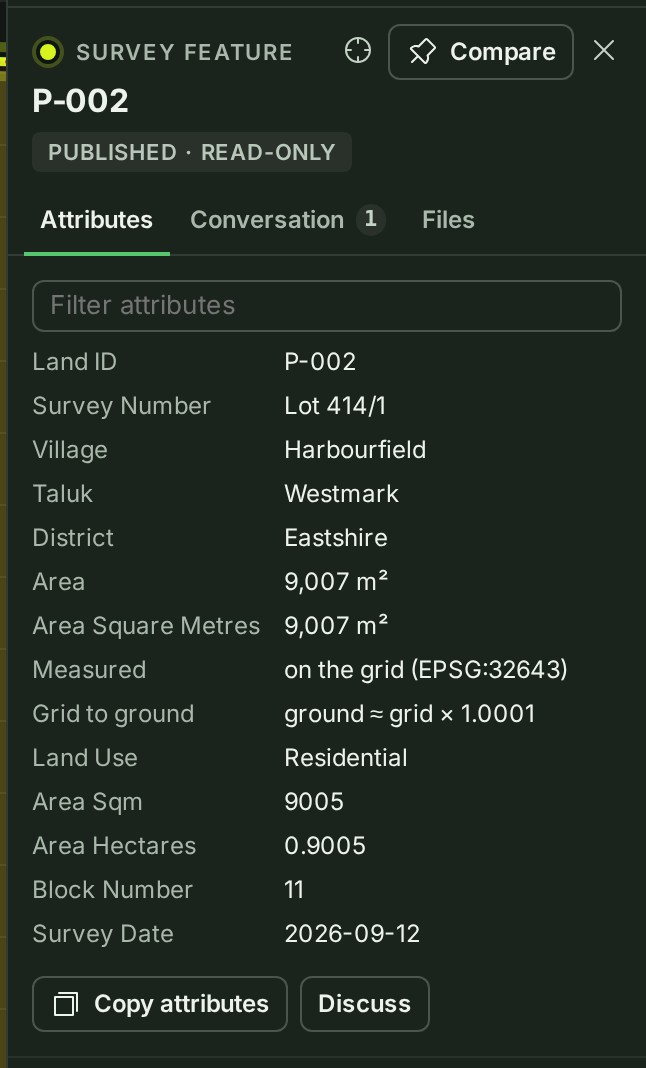
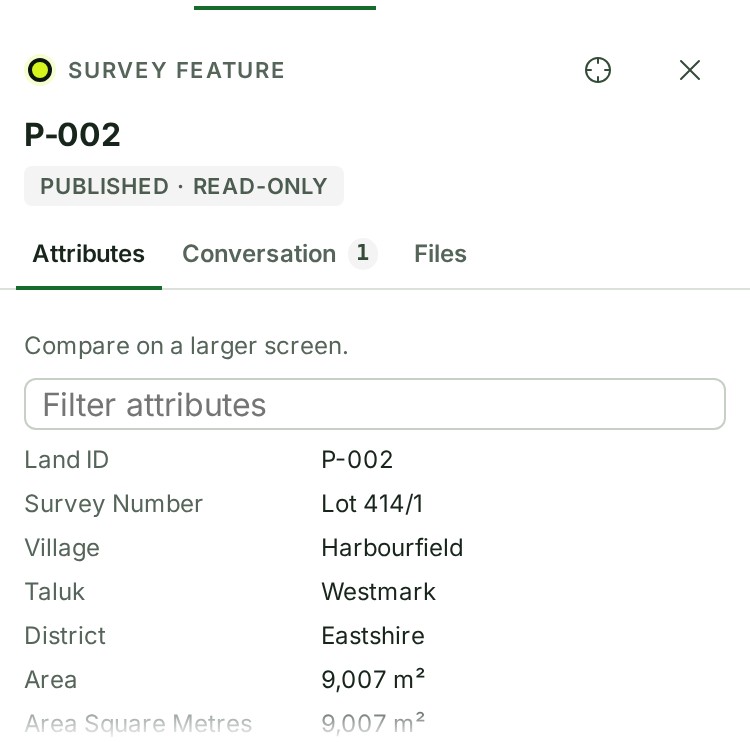
Select a delivered parcel to read its Attributes in the Inspector. Copy attributes copies all its attributes and appears only on that tab. For more than ten attributes, use Filter attributes to find a label or value. Empty delivered values read Not provided; long values take a full row.
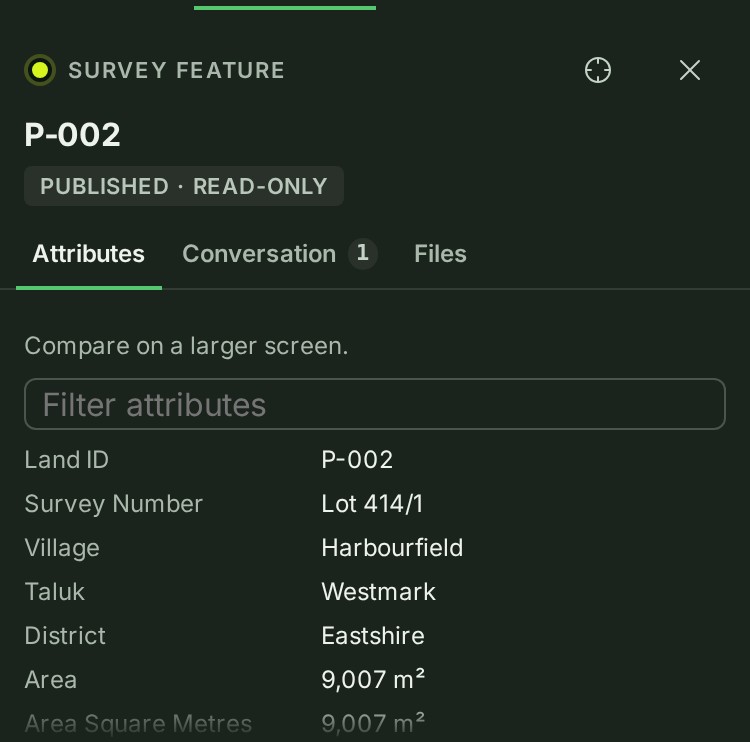
On a larger screen choose Compare to keep the parcel under the map, then select another parcel. See Compare parcels. On a phone, comparison needs a larger screen.